The Numbers Say Avoid Calculus: An Analysis Of Miami University GPA Data
As a young, enthusiastic undergraduate at Miami University, a Public Ivy (just roll with it) in Ohio (not Florida!), I found that choosing the right classes was key to the college experience. Taking enough courses to graduate on time was desirable, and ideally selections would be related to my major, economics. On the other hand, avoiding dastardly professors out to sink one’s grade point average (GPA) was a priority, as was leaving enough time in the day for excessive partying… or, er, being an RA in my case.
Fortunately, Miami made life rather easy by publishing summarized historical grade data for the majority of classes. Each semester, a PDF file documented the trivial and the treacherous of the school's course catalog, allowing future class sign-ups to be made with maximum information. A sample page is shown below for the Spring 2016 semester. Data available includes course department, number, section, professor, and GPA:

Said GPA record brings us to the focus of today’s post: how should a hyper-rational, blog-reading, and most importantly GPA-maximizing Miami University student choose classes? And are there some lessons here on the effectiveness of GPA as a common measure of academic success? I’ve crunched historical GPA data from 1999-2016 to find the answer- there’s even a proper regression model at the end!
Tip 1: Don't Bother With Undergrad, Just Head To Grad School
No need to mess around in those intro classes: grad school is MUCH softer than undergraduate. At Miami, around 70% of graduate level grades are either A's or A+'s, compared to under 40% for 100-400 level courses.

Tip 2: If You Do Take On Undergrad, Be Wary Of Chemistry And Calculus
The chart below shows the 30 most popular Miami classes over the entire data range, sorted by average GPA:

It turns out that "understanding the earth" is much easier than grokking Intro. Chem. I am also proud to inform the reader that Miami's economics department boasts TWO GPA ruiners!
Sidenote: Miami's most famous econ graduate is the one and only Paul Ryan, so you now know which school to blame for any impending budgetary meltdown.
Tip 3: Winter Is Coming, To Boost Your GPA
Miami recently introduced a four week winter term, designed to help students "expand their academic options" while also helping the school expand total revenue. Whatever the purpose, this mini-semester does not appear particularly difficult, so the determined student may want to pick up a couple of classes.

Tip 4: Pick The "Right" Major
There is a tremendous amount of variation in average course GPA across departments at Miami. The Tableau workbook below (sorry readers on mobile, screenshot only for you), shows GPA by department for the last three years of data. The size of the boxes corresponds to the number of grades given in that department's courses (English is the largest), while the color relates to the average GPA given. Hover over to see exact numbers, and toggle at the bottom to see departments outside of the largest 20, along with breakdowns by course level.
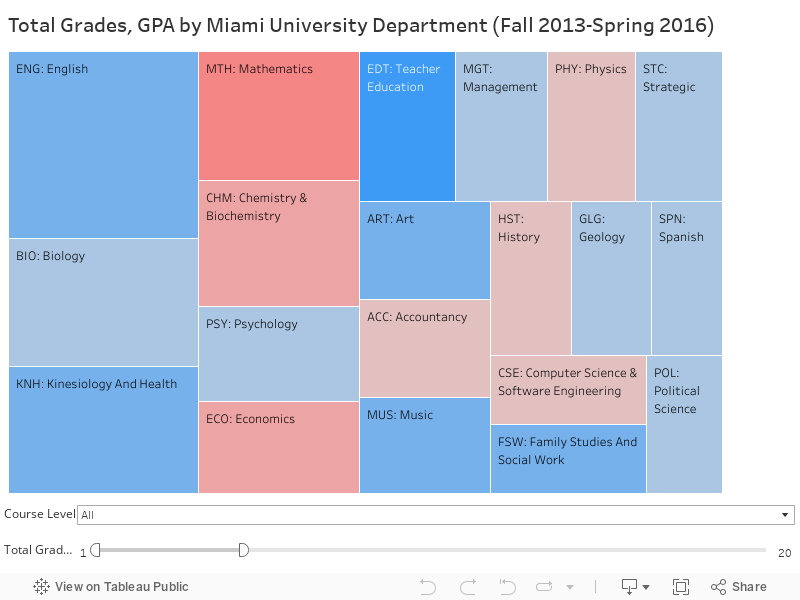
It's perhaps worth noting that STEM areas have some of the lowest grades, highlighting GPA's flaws as an indicator of academic achievement. GPA has remained relevant due to its ease of calculation and comprehension - "It's on a scale of 0-4, higher is better" - but the metric conspicuously fails to account for individual course difficulty or total courses taken.
Here, picking the "right" major based on GPA likely leads to a different conclusion than trying to maximize mid-career salary. Unfortunately, coming up with a better metric is easier said than done. Measuring a student's GPA relative to the average GPA of, say, students in the same course or major would be one way to do it, but this requires lots of information to be made public. It also doesn't account for selection bias across majors, as well as differences in grading standards between universities. Clearly employers will just have to rely on improving their interview processes in order to find the best candidates.
Tip 5: Don't Put Off School In Hopes Of Future Grade Inflation
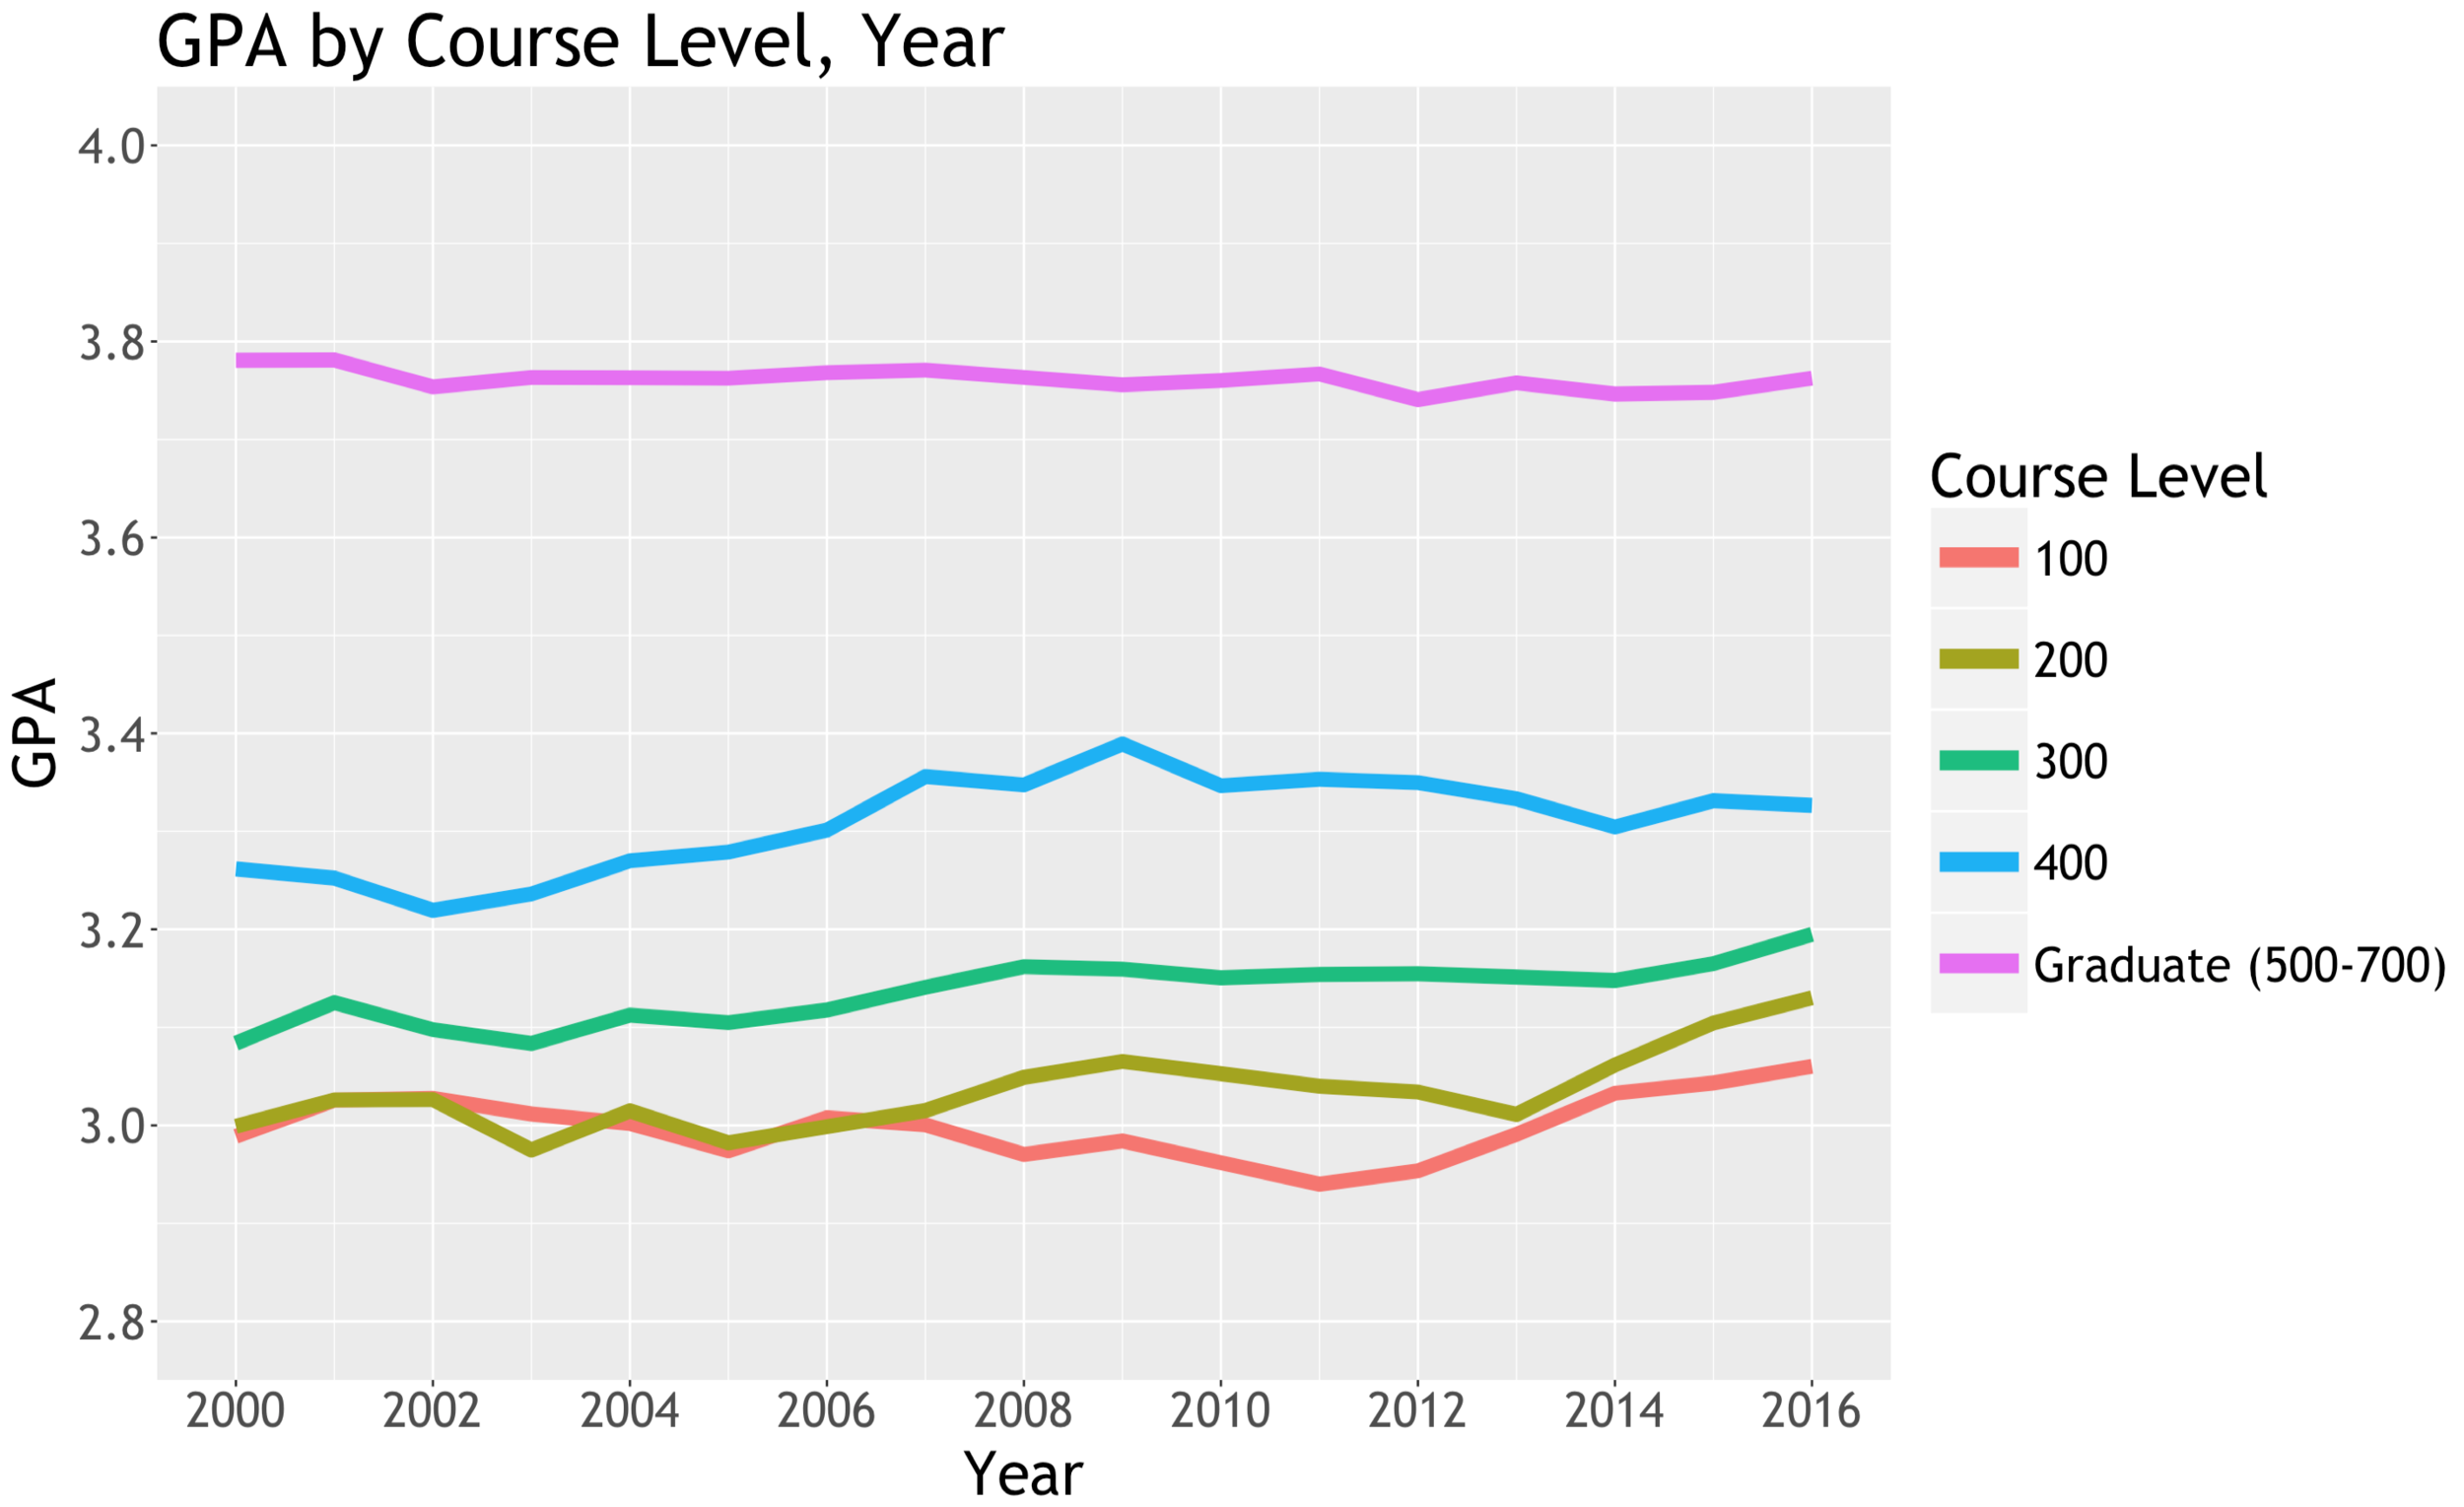
While there is "slight" evidence of an uptick in grades for 100 and 200 level courses in the past few years, an epidemic of grade inflation appears unrealized, at least at Miami. It must be an Ivy League thing.
And Finally, A Simple Model To Predict Course GPA
Descriptive statistics struggle to account for confounding variables. For example, is the rise in 100 and 200 level GPA in recent years due to grade inflation within existing courses, or have 4.0 seeking students simply switched to easier majors? A model is needed!
For GPA data, a typical ordinary least squares (OLS) regression model would be ineffective as predictions would not be bounded between 0 and 4. Enter beta regression, a form of regression often applied to proportions. Scaling GPA to fall between 0 and 1 makes this work. Advantages of beta regression include:
- Can handle data bounded within a certain range
- Non-constant variance is allowed through precision parameters
- There's an easy-to-use R package!
Beta regression is one of those topics that I wish we'd spent more time on in school, since it actually applies to "real-world" problems.
Fitting the model in R was quite simple. The code below shows the formula used. Note that the first set of variables relate to predict mean GPA, while the second group (Dept_new + GPA_total) are precision parameters affecting variance estimates. Each observation in the data is a particular section for a given course in a given semester. The reponse variable, "GPA_scale", is the section's GPA, scaled to fall between 0 and 1. I used BIC to parse down variables in hopes of gaining a parsimonious model that would predict GPA adequately.
gy.6 <- betareg(GPA_scale ~
                  academic_year
                + GPA_total
                + class_level_num
                + Dept_new
                + lux_flag
                + lab_flag
                + hon_flag
                + semester_name
                + multiple_sections
                + first_year_flag
                + prof_first_year_flag
                + total_sections
                | Dept_new + GPA_total
                ,data = train_dat)
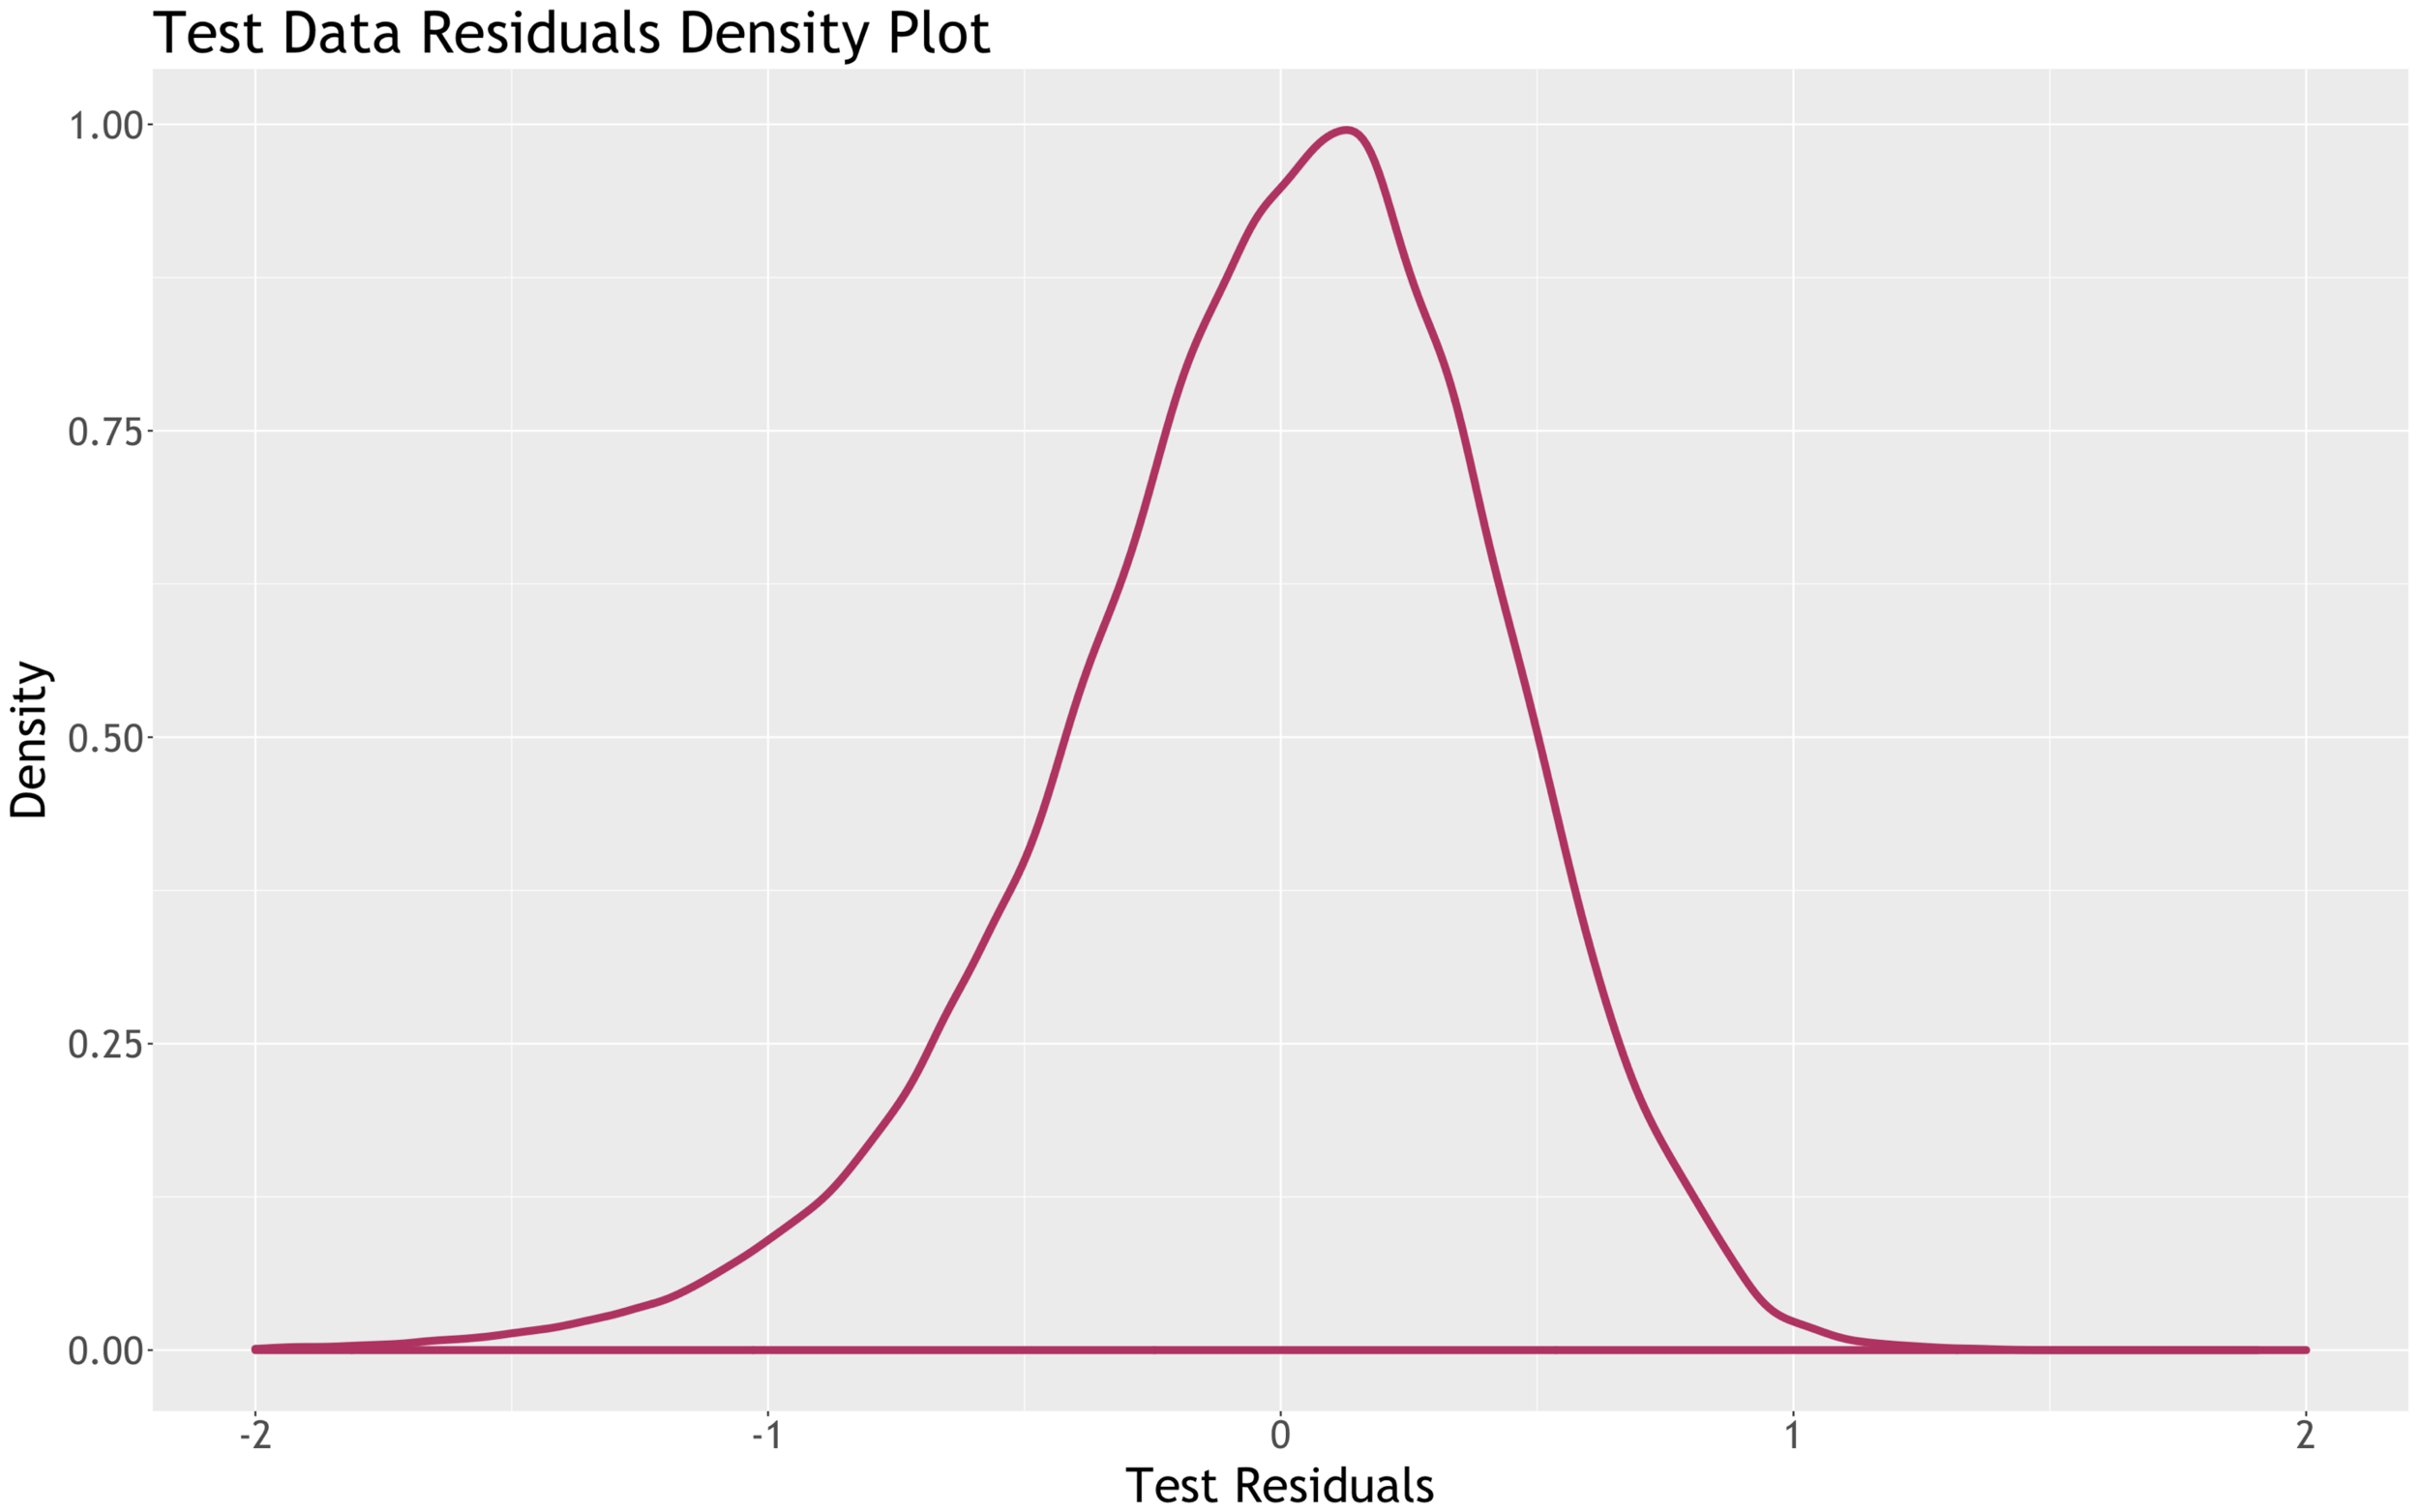
After all this build-up, did the model actually work? Kind of! The charts below shows predicted GPA vs actual GPA for a holdout set (data not used to fit the model), as well as a density plot of the residuals. Overall the fit is reasonable, and there is a clear correlation between predicted and actual GPA. In addition, a check of Pearson residuals indicated no issues.

Looking at the coefficients from the model is where things get a little dicey. Due to a logit link, there isn't an obvious interpretation in the context of GPA. However, we CAN say that a positive coefficient indicates an increase in predicted GPA as the value of the variable increases. From this measure, Honors classes, classes taken in Luxembourg, and Winter semester courses all yield GPA boosts (although note that there is obvious selection bias at play here). Department-level coefficients were excluded for brevity.
Selected Beta Regression Model Output, Logit Link
| Variable | Description | Coefficient | Std. Error | P-Value |
|---|---|---|---|---|
| (Intercept) | Intercept | 0.2456 | 0.02768 | 0 |
| academic_year | Course Year (2000-2016), coded as 1-17 | 0.00265 | 0.00079 | 0.00087 |
| GPA_total | Total students receiving grade | 0.00035 | 0.0001 | 0.00029 |
| class_level_num | Course Level (100-700), coded as 1-7 | 0.24418 | 0.00421 | 0 |
| lux_flag | Course taught in Luxembourg | 0.80756 | 0.04908 | 0 |
| lab_flag | Laboratory course | 0.33277 | 0.05211 | 0 |
| hon_flag | Honors course | 1.07622 | 0.04401 | 0 |
| semester_nameSpring | Spring semester | -0.00749 | 0.00788 | 0.3422 |
| semester_nameSummer | Summer semester | 0.23709 | 0.01686 | 0 |
| semester_nameWinter | Winter semester | 0.53646 | 0.05265 | 0 |
| multiple_sections | Course had multiple sections in the semester (1/0) | -0.11054 | 0.01161 | 0 |
| first_year_flag | First year for course | 0.24518 | 0.02085 | 0 |
| prof_first_year_flag | First year for professor | 0.12519 | 0.0117 | 0 |
| total_sections | Total sections offered for course | 0.00155 | 0.00019 | 0 |
So, er, how to actually figure out which variables are meaningful? In order to better estimate the effect of coefficients, I re-scored holdout set observations after switching the value of a single parameter, then computed the change in estimated GPA to assess the variable's influence. Honors courses, for example, are extremely influential, with the GPA change density plot peaking at around a 0.5 point increase:

On the other hand, there is little evidence for any sort of grade inflation, as a simulated ten year increase in academic year (I limited to pre-2007 courses to avoid extrapolation outside the range of training data) yields virtually no change in estimated GPA:

Finally, for students seeking the slightest edge, there is evidence that one may want to opt for new courses and/or courses taught by new instructors. Flags for these classes both show a slight boost in expected GPA:


Interested in replicating/critiquing the model? All code is available here!